“Coding Druid” series is my horizontal programming practice notes, each part around a topic like mathematical, physics, electronic, graphics, sound, etc., implemented in several programming languages.
Coding Druid
Part: Math
Chapter: Trigonometric Function
Section: Python
In the previous two sections, I visualized Trigonometric function (Sine and unit circle) by MaxMSP and JavaScript (React):

Trigonometric Function Visualization Using MaxMSP

Sine Function Visualization Using JavaScript (React)
This time I use Python to implement it.
For the quick goal, directly Google “python data visualization lib” these keywords, get the lib, sort by the number of stars in github, found the old and strong Matplotlib. So, it was so pleasant to decide.
Matplotplib Install
Consider the follow-up exercises, I select the whole-family-bucket installation method provided by Anaconda. It includes a bunch of libraries related to scientific data analysis including Matplotlib.

Due to the recent unfixed working computer and location, I’ve deployed a remote development environment (VSCode Remote rocks!). The code is deploying and running on the Azure server. I just use a old notebook to edit the code and view the effect.
So I choose the Linux version for the server environment.

Note, the Python 3.x version on the left is preferred here, because Matplotlib 3.0 and above only supports Python 3.
Matplotlib 3.0 is Python 3 only.
For Python 2 support, Matplotlib 2.2.x will be continued as a LTS release and updated with bugfixes until January 1, 2020.
Then you can start coding after Matplotlib installing.
(In fact, after writing a few lines, I found that remotely developing Python, it is still not convenient to view the result graphics in real time. So I also installed [Jupyter Notebook] (https://jupyter.org/) and coding directly in the browser, WYSIWYG.)
In addition, ffmpeg is installed too, to save the animation obtained by Matplotlib to mp4.
Also used Anaconda to install ffmpeg.conda install -c conda-forge ffmpeg
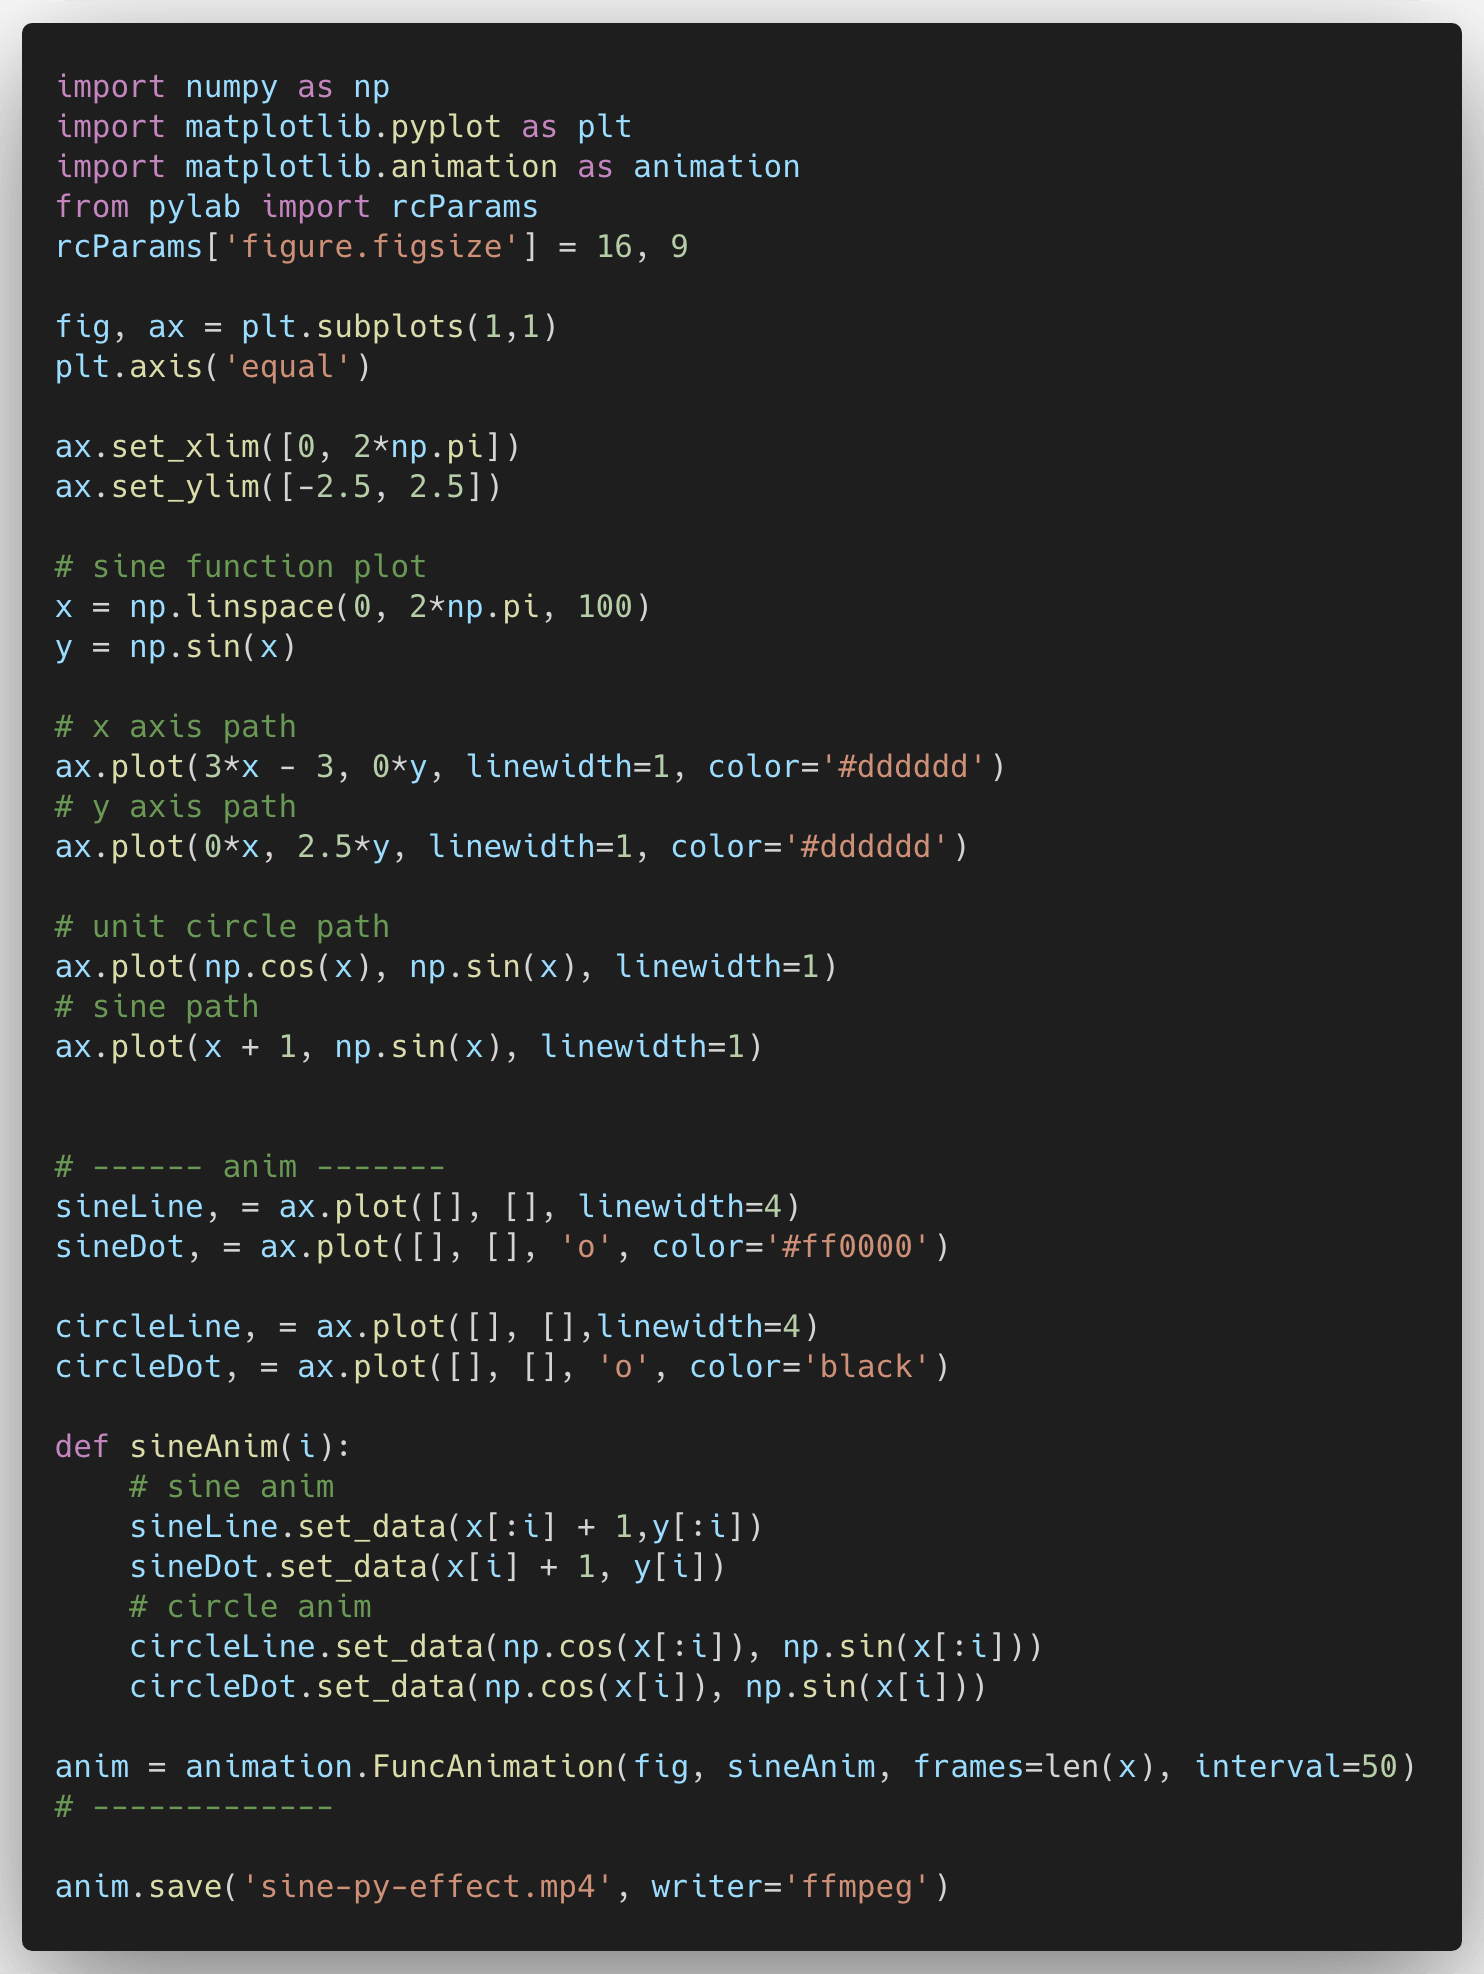
With Matplotlib, the Sine function animation part, in fact, there is not a few code. Most is actually the coordinate configuration, and draw some auxiliary lines and so on.

Basically coding by according to the tutorial and some reference articles. The characteristics of this library, most of the ideas focus on the algorithmic logic of the mathematical formula itself.
A nice reference article:
Animations with Matplotlib
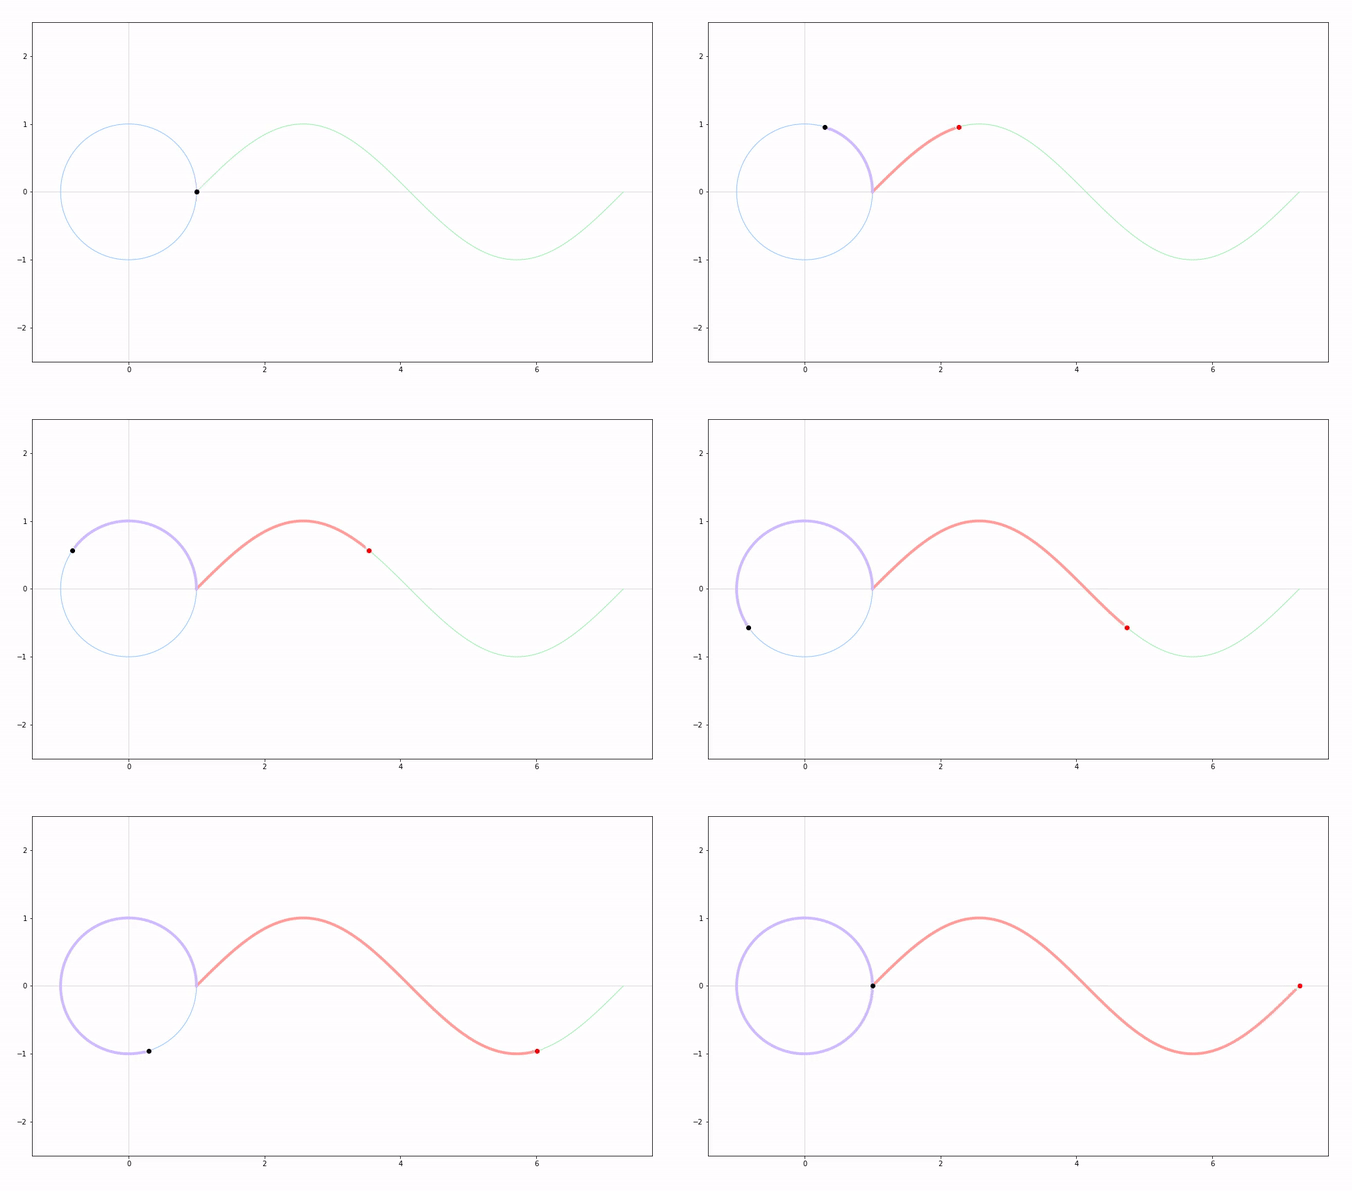
Final Effect:

Talk is cheap. Show me the code!
This demo and the “Coding Druid” series is open source here:
https://github.com/avantcontra/coding-druid
You can find more resources in my site floatbug.com.
Or you may buy me a coffee in my Patreon. Your encouragement is my driving energy!
https://www.patreon.com/avantcontra
Cheers~
Contra
Fb/Tw/Ins/Github: @avantcontra
Website: floatbug.com

Comments
3 responses to “Sine function visualization using Python”
[…] Trigonometric function (Sine and unit circle) separately using MaxMSP, JavaScript (React), Python, […]
[…] Trigonometric function (Sine and Unit Circle) separately using MaxMSP, JavaScript (React), Python, […]
[…] the note Sine function visualization using Python I used Jupyter Notebook as Python IDE/Playground.Jupyter is a great online IDE for […]