“Coding Druid” series is my horizontal programming practice notes, each part around a topic like mathematical, physics, electronic, graphics, sound, etc., implemented in several programming languages.
Coding Druid
Part: Math
Chapter: Trigonometric Function
Section: Javascript (React)
In the previous section, I visualized Trigonometric function (Sine and unit circle) by MaxMSP:
Trigonometric Function Visualization Using MaxMSP — “Coding Druid”
This time I use javascript to implement it.
There are kinds of ways to draw graphic in javascript in browser:
- Directly in Canvas or WebGL
- d3js
- p5js
- pixijs
- SVG + CSS
- More and more
I found a React + SVG example by chance, and I very like it.
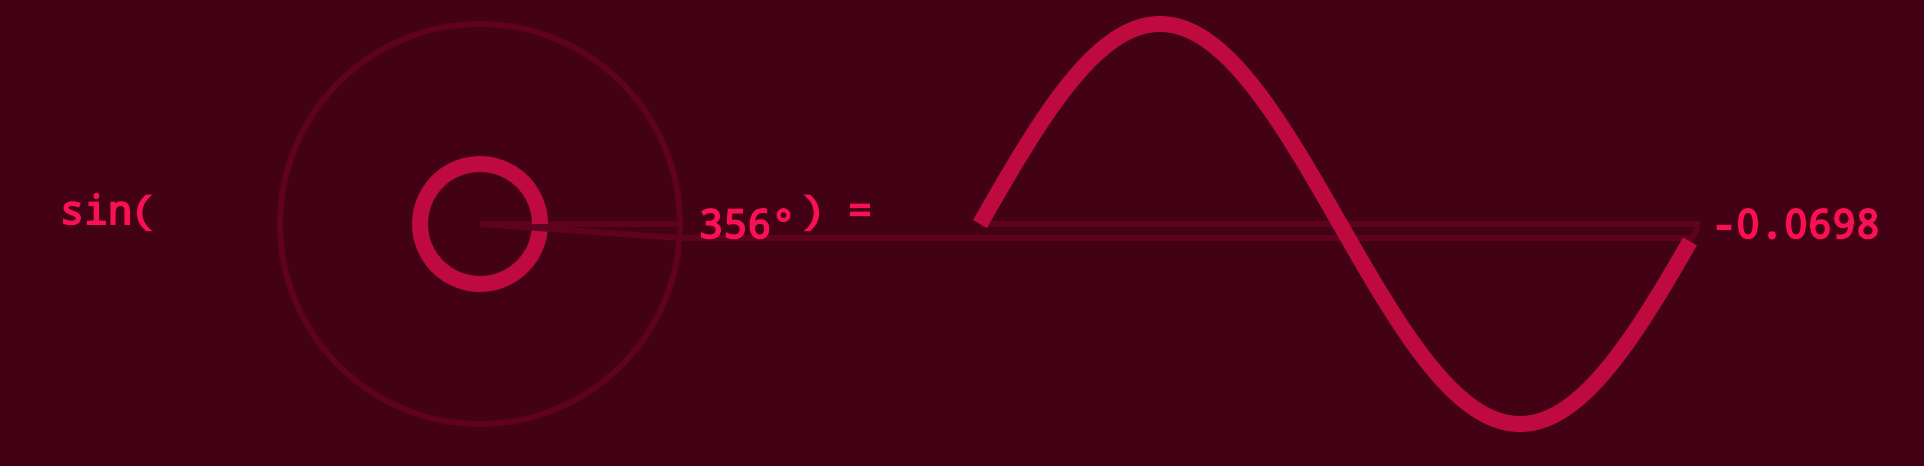
The SVG descripted Sine function in a marked way:
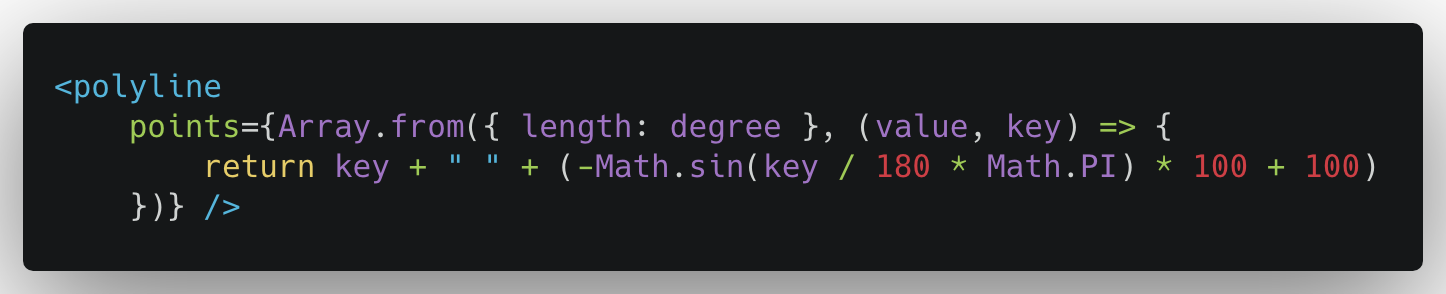
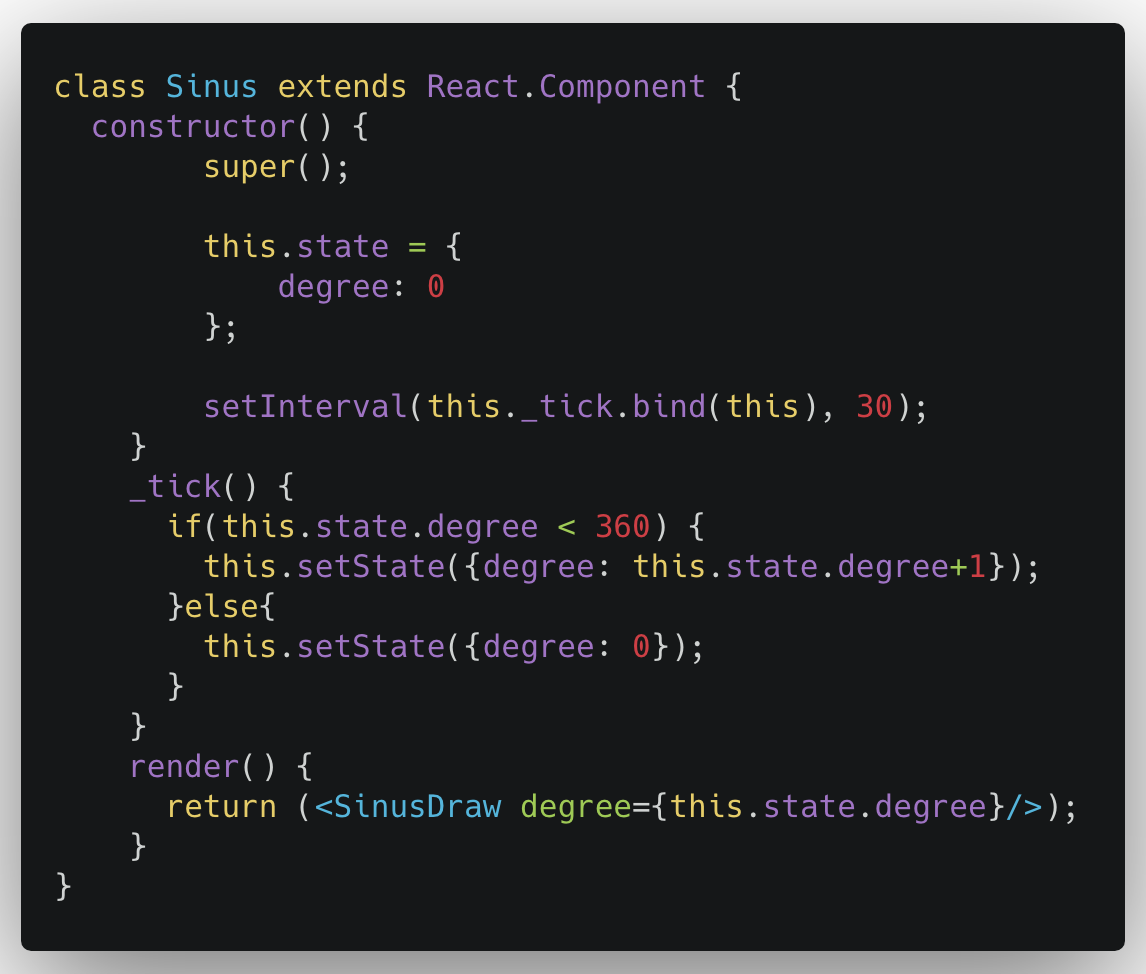
And binding and updating the value of param degree along x-axis taking advantage of the updating mechanism of React State.
I think its a beautiful and charming way.
I rarely used SVG in my past projects. Then I learn it from this example and cool! Thanks for its author.
While React is my most commonly used library in front-end projects for years. But I’m new with its latest features like React Hooks. So I study and refactor the React State part of the example using React Hooks.
The Hooks official document is great. I just followed its rules and implemented the functions like that:
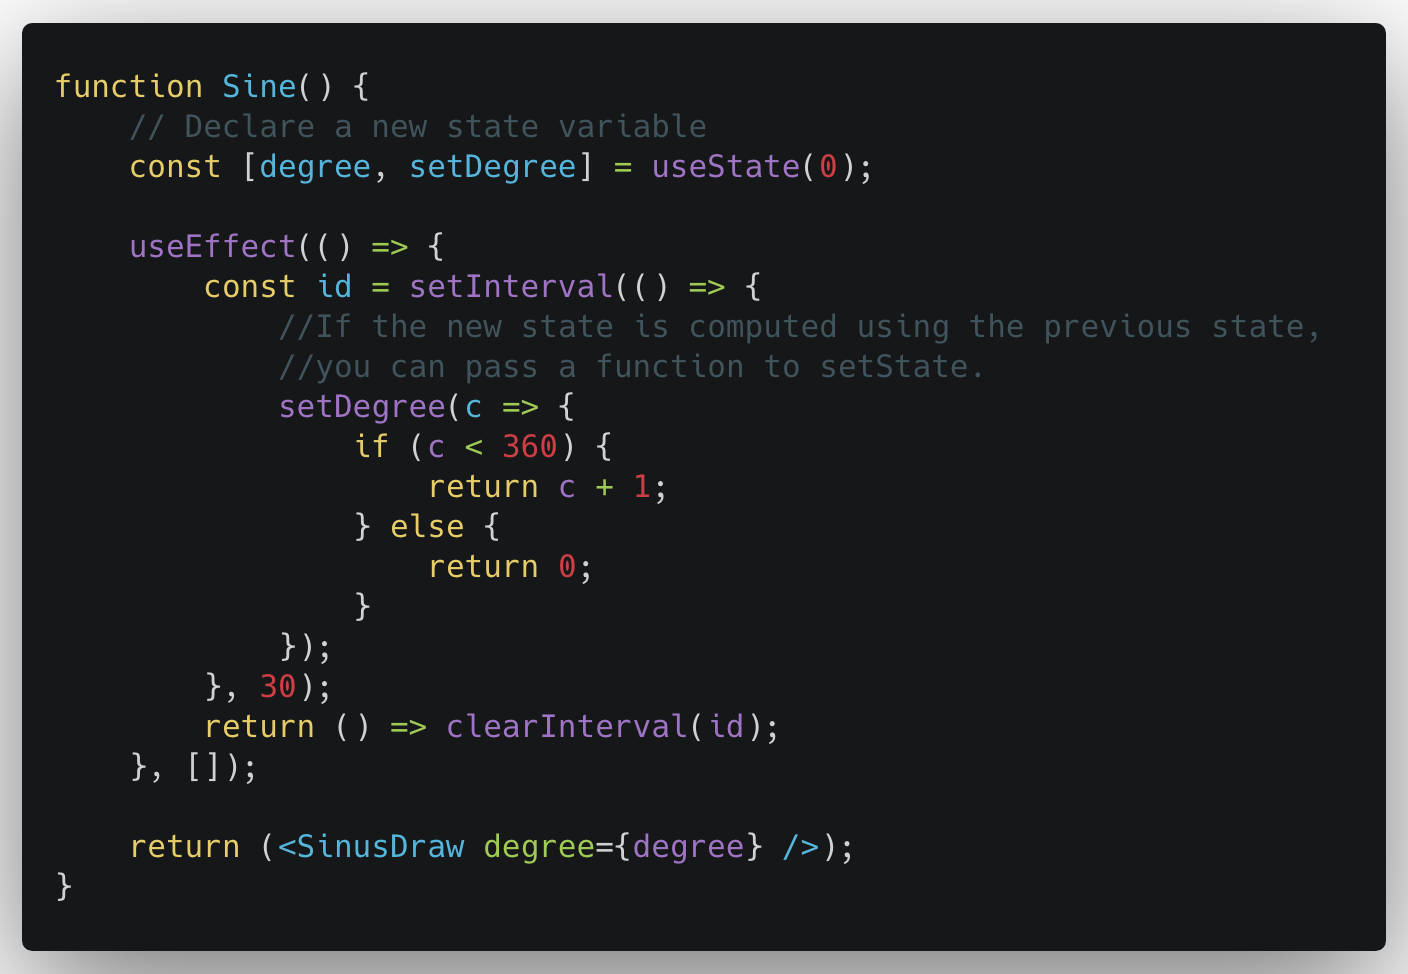
The Hooks is simple and powerful, but you should take care the performance issue. Because the useEffect() will run both after the first render and after every update. The offical tips here.
Final Effect:
Talk is cheap. Show me the code!
This demo and the “Coding Druid” series is open source here:
https://github.com/avantcontra/coding-druid
You can find more resources in my site floatbug.com.
Or you may buy me a coffee in my Patreon. Your encouragement is my driving energy!
https://www.patreon.com/avantcontra
Cheers~
Contra
Fb/Tw/Ins/Github: @avantcontra
Website: floatbug.com
Comments
4 responses to “Sine function visualization using React Hooks”
[…] Sine Function Visualization Using JavaScript (React) […]
[…] Sine function visualization using JavaScript (React) […]
[…] Chapter, I visualized Trigonometric function (Sine and unit circle) separately using MaxMSP, JavaScript (React), Python, […]
[…] Chapter, I visualized Trigonometric function (Sine and Unit Circle) separately using MaxMSP, JavaScript (React), Python, […]