Recently, in the Fourier Series chapter of “Coding Druid”, I practiced the visualization of Fourier Series and demonstrated the periodic square wave curve, which can be decomposed into a series of sine wave curves:
Above is Python (Blender) version. There are JavaScript (React) version, and Unity version.
“Coding Druid” series is my horizontal programming practice notes, each part around a topic like mathematical, physics, electronic, graphics, sound, etc., implemented in several programming languages.
This time I’m try to draw something with Fourier Series, and explain the principle as simple and intuitive as possible.
Simple and intuitive principle explanation
The visualizations in the previous exercises were performed in a two-dimensional space, such as a sine wave:
Square wave:
The relationship between the left circle (Epicycle) and the right sine/square wave:
- In left half there is a moving point along a circle or combination of circles rotated with time t;
- The right half is mapping time t to the horizontal axis (x axis), the vertical axis is still the current y value of the moving point.
In other words, converting the time domain to the space domain, then you can get a sine curve from a circle, or from a series of circles to get a square wave curve.
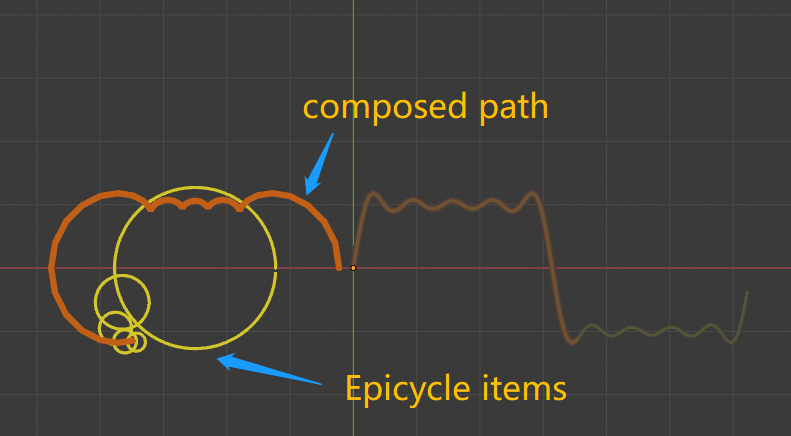
Let’s draw the path of the moving points of both the left and right sides of the square wave:


The path of a series circles (Epicycle) at the left, and the path of a square wave at the right are actually just the same moving point displayed in different spaces.
Suddenly cheerful right?!
To make it clearer, change the space domain from two-dimensional to three-dimensional. Time t is no longer mapped to the x-axis, but to the z-axis:
When the coordinate axis is rotated in three-dimensional space, the above picture is still a circle when viewed from the front. But when viewed from the side, it is actually a sine curve.
The same is true for square waves:
The orange path on the front, after conversing angle and viewed from the side, is the curve of the square wave.
Suddenly cheerful again?!!
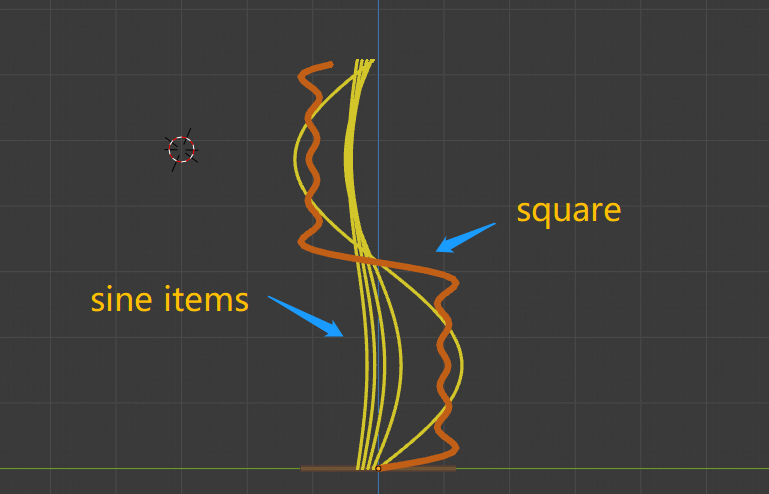
Further, according to the Fourier Series principle, in order to obtain the square wave (orange), we must find a way to obtain a series of sine waves (golden yellow) that make up the square wave:
From another perspective, in order to get the final motion path (orange), we must find a way to get a series of Epicycle circles (golden) that make up the path:
And this orange motion path can be of various shapes, that is, no matter what graphics you want to draw, as long as you find a series of Epicycle circles according to the principle of the Fourier Series, then you can draw them!

How is it easier to understand the principle of Fourier Series drawing in this way?
The next thing to solve is the problem of how to find a corresponding set of Epicycle circles for “arbitrary” patterns.
Mathematically speaking, it is to find the Fourier coefficients (a and b) corresponding to each sub-item in the Fourier Series:
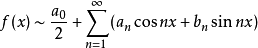
After the coefficients a and b are found, they can be combined to obtain f (x).
There are many ways to find the Fourier coefficients, such as integration, Fourier transform, and so on.
Perform the Fourier transform directly on the pattern path to obtain the Fourier coefficient.
In computer programs, all data is discrete, so in practice, the discrete Fourier transform is used in the program.
Regarding this there are many reference resources which are listed below.
The pictures and animations in this article were completed using Blender + Python:
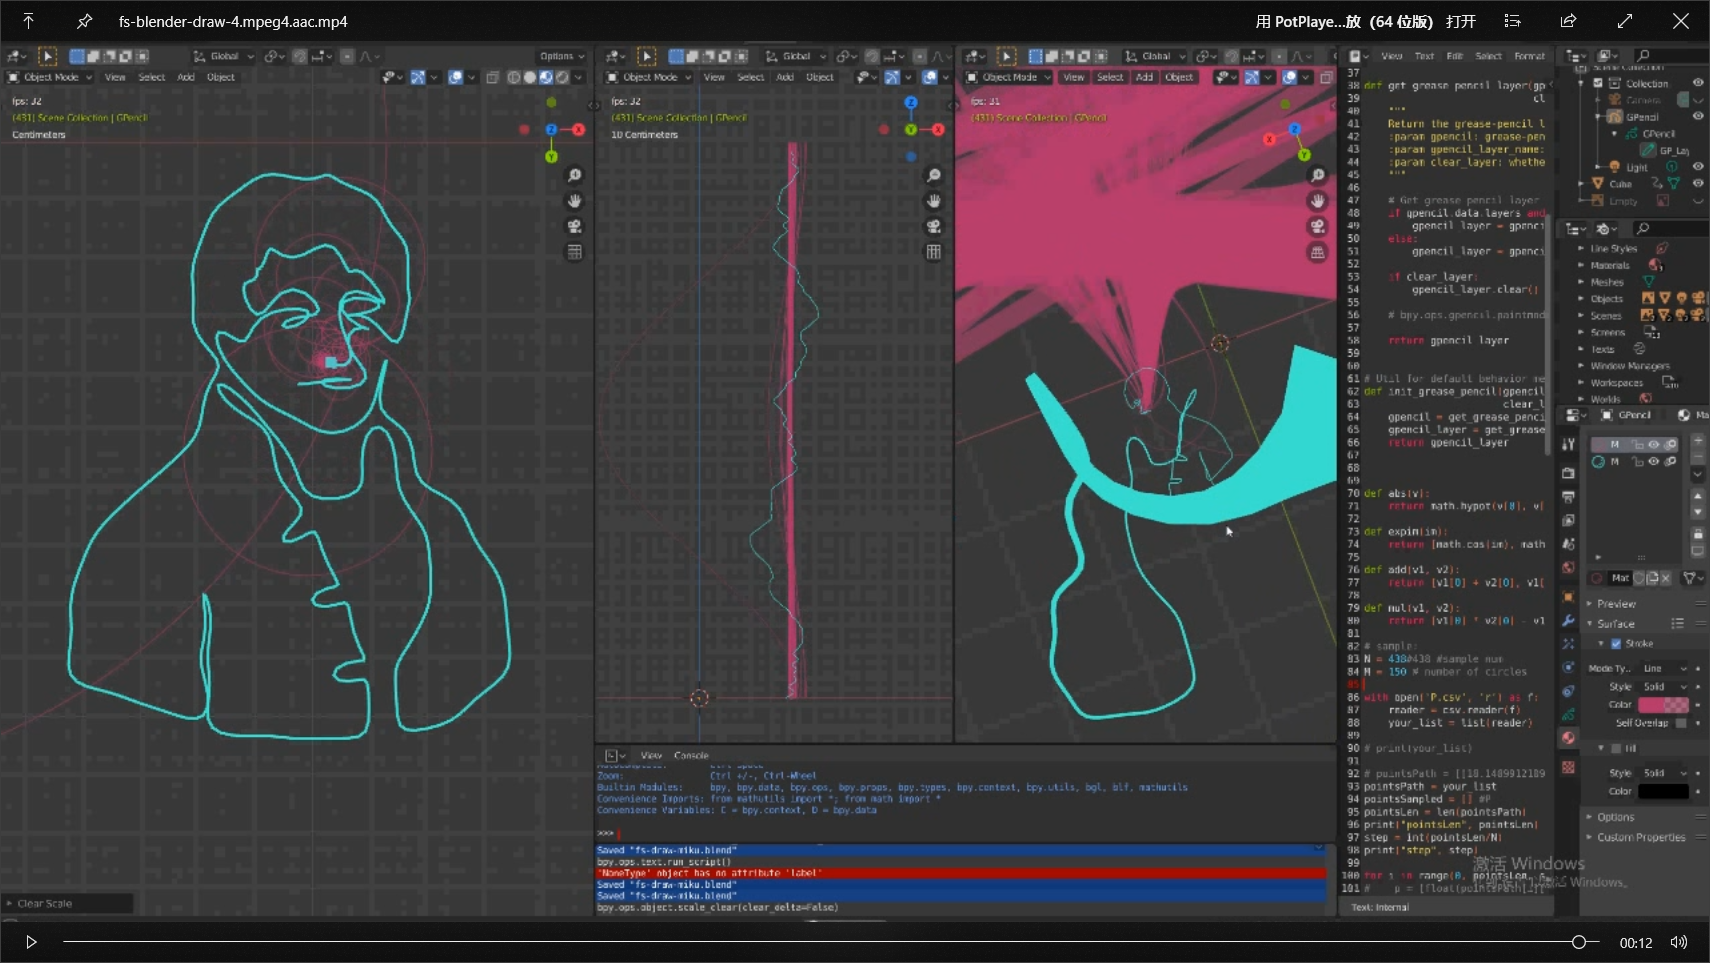
Wait a minute, it’s not over.
From the color matching of Fourier in the picture above, you may see that I originally planned to draw Hatsune Miku:

However, compared to drawing using Fourier Series, in fact it is more difficult to find a suitable pattern path.
Mathematically speaking, under the constraints of certain conditions, a function can be expressed by Fourier series.
The process of finding this pattern’s path is far more complicated than drawing the path itself with Fourier Series.
Articles of other experts will be attached for reference later.
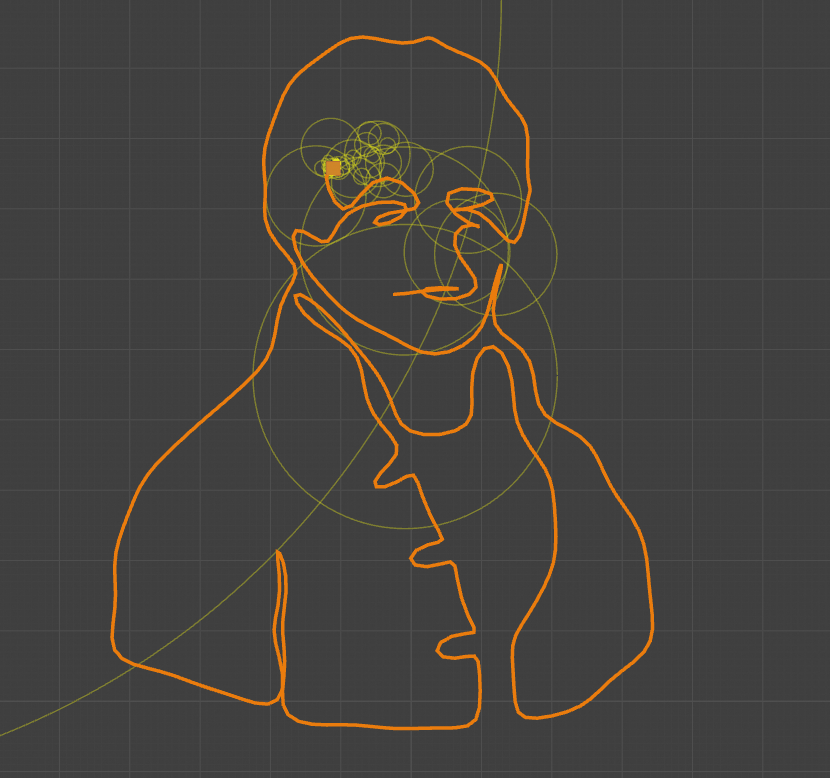
The energy invested in this article can only draw simple path, so Miku was replaced with old man Fourier 🙂:
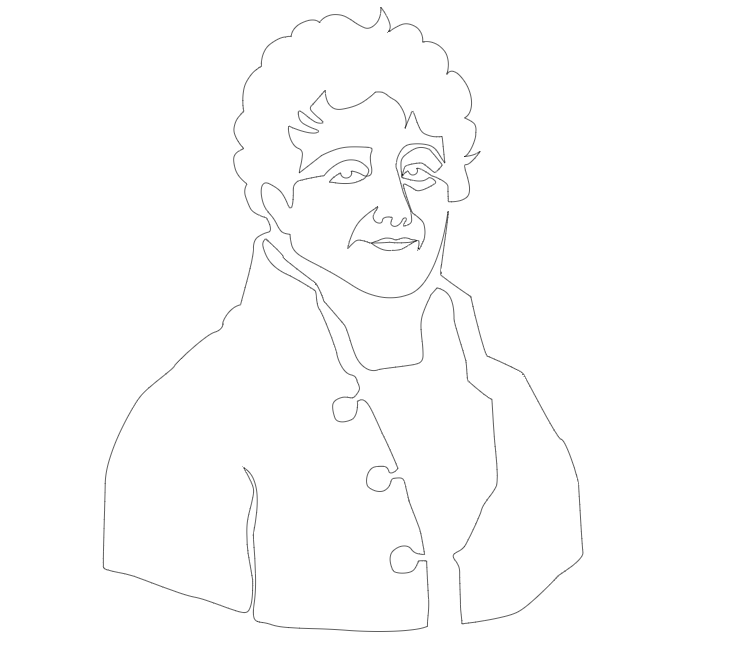
Final effect (three perspectives):
Reference resources
- Using Blender to run Python and visualizing the Fourier Series
My introductory study note on how to use Blender to run Python. - An Interactive Introduction to Fourier Transforms
Very good front-end JavaScript implementation for Fourier Series drawing. - Drawing with Fourier Transform and Epicycles
Shiffman’s explanation and p5.js implementation. - But what is a Fourier series? From heat flow to circle drawings | DE4
3Blue1Brown!! - Epicycles, complex Fourier series and Homer Simpson’s orbit
Another tutorial from Mathologer. - 手把手教你用傅立叶变换画可达鸭
More is talking about how to get the optimal contour of the pattern.
Talk is cheap. Show me the code!
You can get the source code of the final effect in my Patreon.
There are many articles, patches, source code and some advanced Patron-only content there.
And the “Coding Druid” series is almost open source here:
https://github.com/avantcontra/coding-druid
You can find more articles in my site floatbug.com.
Your encouragement is my driving energy!
Cheers~
Contra
- Website: floatbug.com
- Patreon (advanced content): avantcontra
- Github: avantcontra
- Facebook: avantcontra
- Twitter: avantcontra
- Instagram: avantcontra
Comments
2 responses to “Drawing anything with Fourier Series using Blender and Python”
[…] Drawing anything with Fourier Series using Blender and Python Advertisement of my article XD […]
[…] source : https://floatbug.com/drawing-anything-with-fourier-series-using-blender-and-python/ […]