“Coding Druid” series is my horizontal programming practice notes, each part around a topic like mathematical, physics, electronic, graphics, sound, etc., implemented in several programming languages.
Coding Druid
Part: Math
Chapter: Fourier Series
Section: Javascript (React)
In the previous Chapter, I visualized Trigonometric function (Sine and unit circle) separately using MaxMSP, JavaScript (React), Python, and Unity:

This chapter I implement Fourier Series curve visualization.
And start with JavaScript and React this section.
Mathematics
In mathematics, a Fourier series is a periodic function composed of harmonically related sinusoids, combined by a weighted summation.
(wikipedia)
And it can be explained as expressing a repetitive curve as sum of sine curves. (Purrier Series (Meow) and Making Images Speak)
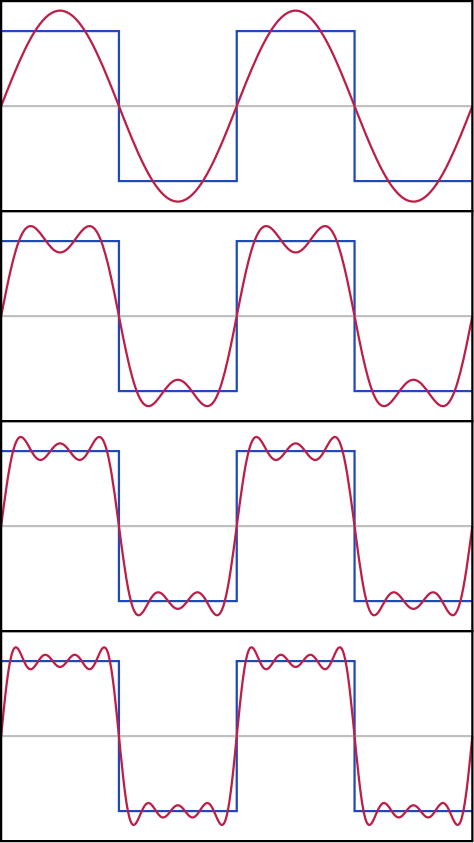
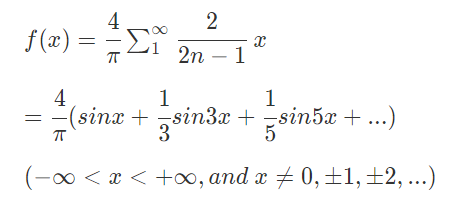
For example, suppose there is a square wave, and it can be interpreted into sine waves:
The more sine waves you have, the preciser square wave you will get.
Now Let’s see the process of Fourier series expansion.
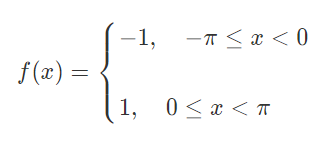
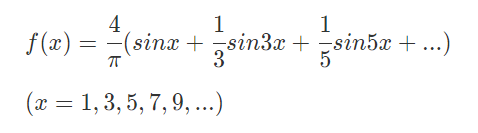
Assume that f(x) is a periodic function for x∈[−π,π], and its period is 2π .
Its expression:
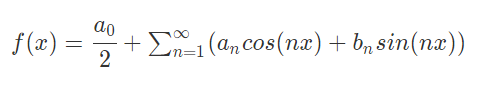
Then its trigonometric expression of Fourier series (sine-cosine form) is like:
And Fourier coefficients of f(x)f(x) is:
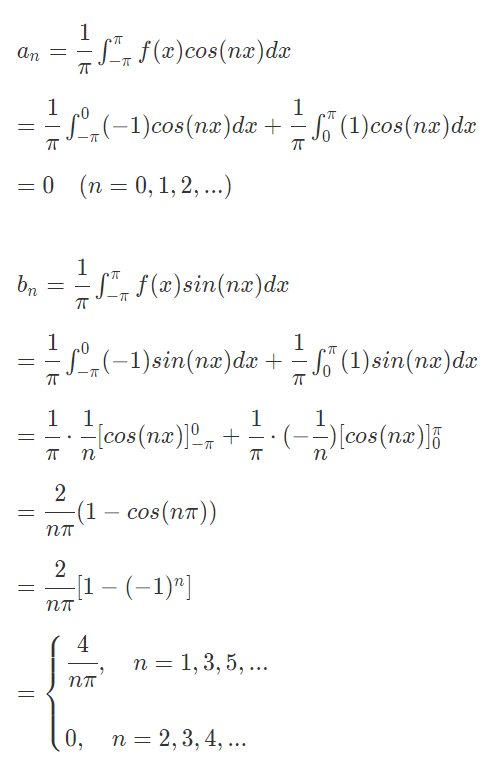
Finally:
Above content refers to “Advanced Mathematics – (Engineering Course) (Vol.2)”
And the original Fourier series definition and detail explanation will be found in wikipedia.
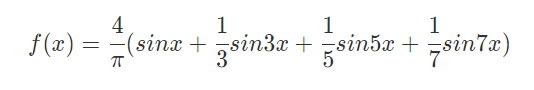
Sums of lengths the first four terms, and showing how the approximation to a square wave:
Visualization
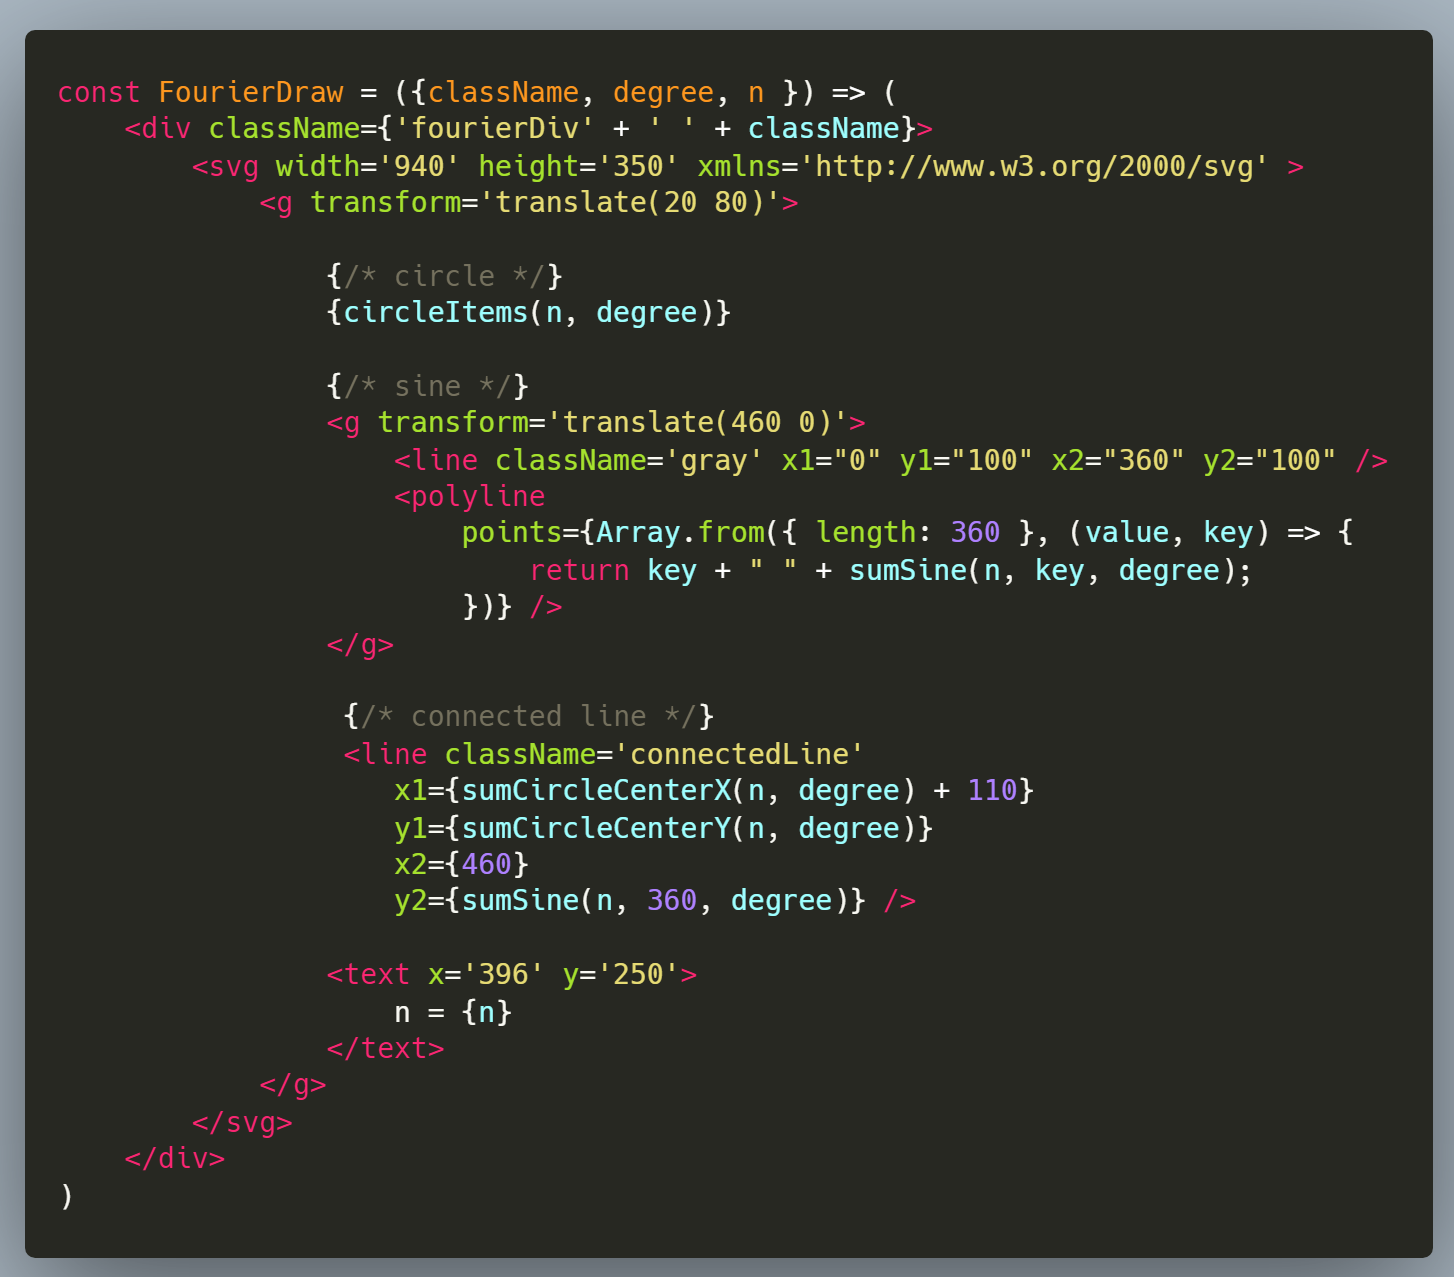
Now to visualize this curve using React.
I have forked and refactored a sine visualization:
I will do the Fourier stuff on the basis of above code.
It’s really clear to write code using React:
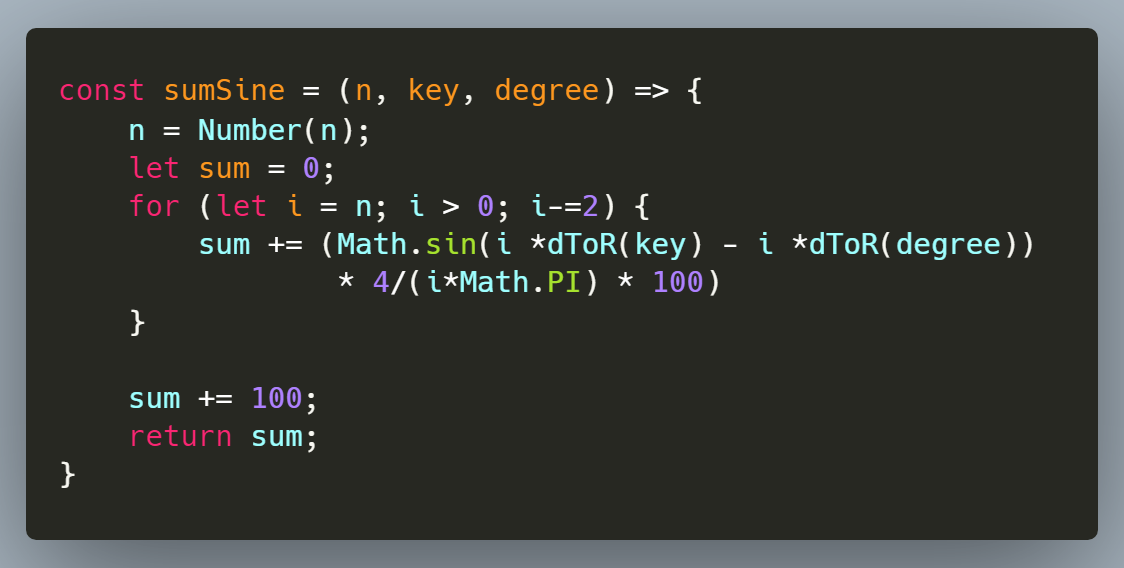
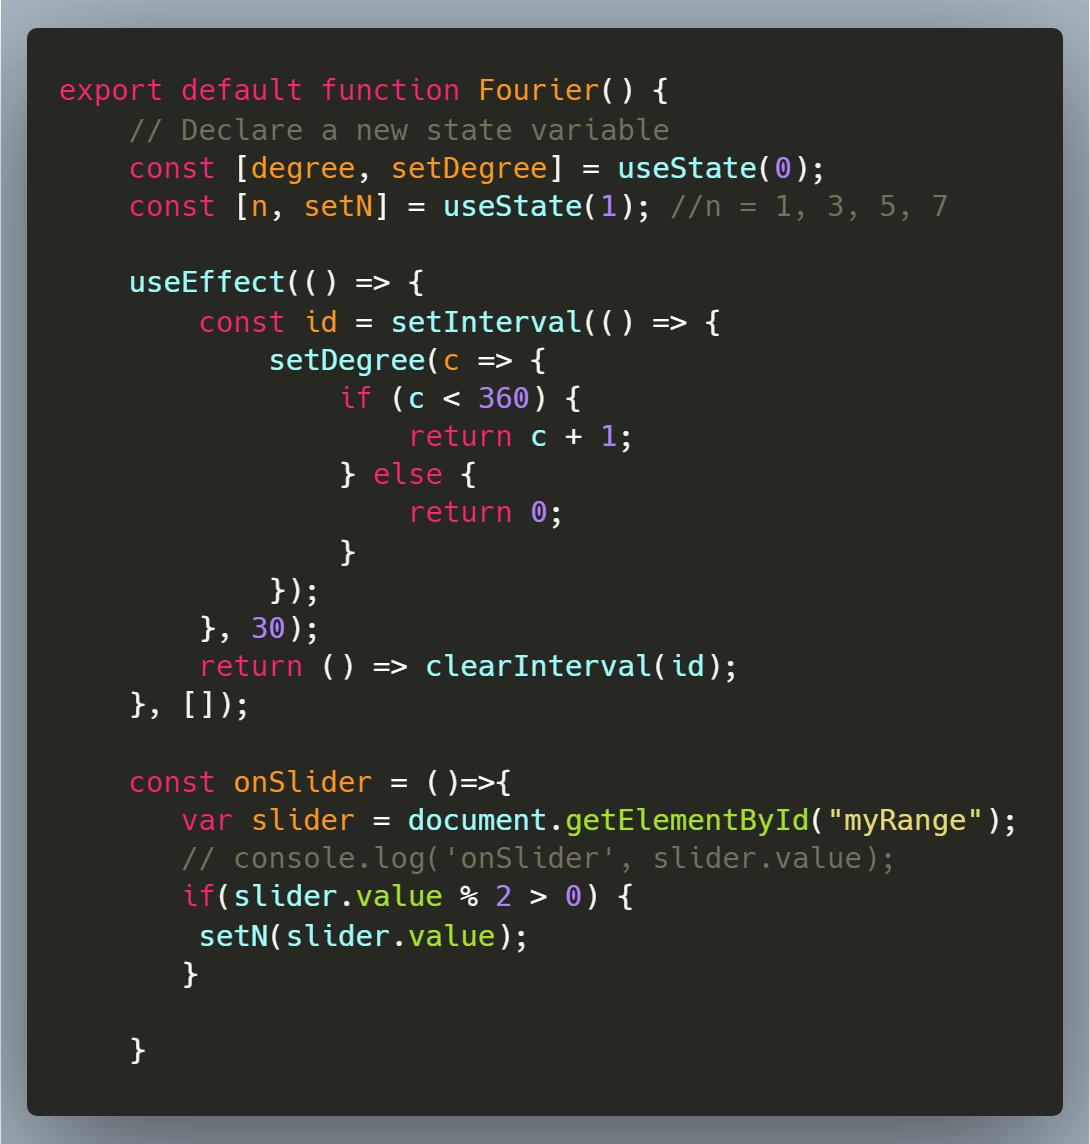
Still use React Hooks to update the data binded with Components:
Final curve:
References
- Wikipedia
- Purrier Series (Meow) and Making Images Speak
- CodingChallenges by Daniel Shiffman
- Advanced Mathematics – (Engineering Course) 高等数学(工科类)
- Signals & Systems (Second Edition) by Alan V. Oppenheim
- [干货]—Fourier级数
Talk is cheap. Show me the code!
This demo and the Coding Druid series is open source here:
https://github.com/avantcontra/coding-druid
You can find more resources in my site floatbug.com.
You may buy me a coffee in my Patreon. There are many articles, patches, source code and some advanced Patron-only content there.
Also you can get some free patches/codes in Gumroad shop.
Your encouragement is my driving energy!
Cheers~
Contra
- Website: floatbug.com
- Github: avantcontra
- Facebook: avantcontra
- Twitter: avantcontra
- Instagram: avantcontra
- Gumroad (buy codes directly): avantcontra
- Patreon (advanced content): avantcontra
Comments
4 responses to “Fourier Series Visualization Using React Hooks”
[…] More graphic explanations and formula derivation, see the previous section: Fourier Series Visualization Using React Hooks . […]
[…] Mathematical knowledge notes on Fourier Series, see Fourier Series Visualization Using React Hooks. […]
[…] 有关傅里叶级数的数学知识学习笔记,可见 JavaScript (React)傅里叶级数可视化 。 […]
[…] is Python (Blender) version. There are JavaScript (React) version, […]